Use your Ansible logs !
I use Ansible on a daily basis. Everyday, my coworkers and i use it to configure our servers and deploy our applications. We use Jenkins to call Ansible commands.
All of this generates a huge amount of logs. We do not do much with these logs, except consulting them after a deployment with the Jenkins interface.
I explain in this post a way to exploit these logs, using Ansible callback plugins. With these plugins, it is possible to get detailed Ansible logs, and easily manipulate them to produce statistics and new information.
Ansible callback plugins
General presentation
Ansible can be "extended" with plugins. I will present here the callback plugin type (documentation). The examples in this post used Ansible 1.X, but the Ansible 2.X callback plugins are almost the same as Ansible 1.X.
This plugin allows to define an object whose functions will be called at different times during the Ansible execution. Example:
class CallbackModule(object):

    def on_any(self, *args, *kwargs):
        pass

    def runner_on_failed(self, host, res, ignore_errors=False):
        pass

    def runner_on_ok(self, host, res):
        pass

    def runner_on_skipped(self, host, item=None):
        pass

    def playbook_on_start(self):
        pass

    def playbook_on_task_start(self, name, is_conditional):
        pass

    = etc...
A callback plugin is just a class implementing some functions. I put a few of them in this example, but there are many more for any Ansible event type (you can find these functions in the Ansible doc or in the callback plugins provided with Ansible).
Detailed presentation
For example, the runner_on_failed function will be called when an Ansible task fails, runner_on_ok when an Ansible task is successfull, runner_on_skipped when a task is skipped…
Functions which begin with playbook_on_ will be executed by events related to playbooks (example: playbook_on_start when a playbook start…).
All these functions receive parameters. This is where it gets interesting. For example, runner_on_ok receives the self, host, and res parameters.
-
The host variable contains the host on which the task applies.
-
The res variable contains some informations about the host (fact variables), as well as some informations about the task being called (task changed or not, Ansible module called in the task…).
-
The callback object self contains a lot of informations on the current Ansible execution. Let’s add import pdb; pdb.set_trace(); in the runner_on_ok function (to use the Python debugger) and let’s start an Ansible deployment. A pp dir(self) allows to list the fields of the object:
(Pdb) pp dir(self)
['__class__',
 '__delattr__',
 '__dict__',
 '__doc__',
 '__format__',
 '__getattribute__',
 '__hash__',
 '__init__',
 '__module__',
 '__new__',
 '__reduce__',
 '__reduce_ex__',
 '__repr__',
 '__setattr__',
 '__sizeof__',
 '__str__',
 '__subclasshook__',
 '__weakref__',
 'on_any',
 'play',
 'playbook',
 'playbook_on_import_for_host',
 'playbook_on_no_hosts_matched',
 'playbook_on_no_hosts_remaining',
 'playbook_on_not_import_for_host',
 'playbook_on_notify',
 'playbook_on_play_start',
 'playbook_on_setup',
 'playbook_on_start',
 'playbook_on_stats',
 'playbook_on_task_start',
 'playbook_on_vars_prompt',
 'runner_on_async_failed',
 'runner_on_async_ok',
 'runner_on_async_poll',
 'runner_on_failed',
 'runner_on_no_hosts',
 'runner_on_ok',
 'runner_on_skipped',
 'runner_on_unreachable',
 'state',
 'task']
The self object is a gold mine ! Using pdb (pp dir(self.task), pp dir(self.play) etc…), we see that we have access to a huge amount of informations about our deployment. Detail of the current task (name, role…), Ansible variables, information about the playbook… Now we can use them !
Of course, each function in the callback plugin will have differents parameters (but some are similar, like runner_on_failed and runner_on_ok).
playbook on start
The playbook_on_start function is called when a playbook is launched. I wanted to initialize some variables on the callback object from extra_vars passed to the ansible_playbook command. Here is a basic example (get_timestamp is a function returning the current timestamp is second):
def playbook_on_start(self):
        extra_vars = self.playbook.extra_vars
        self.project = extra_vars["project"]
        self.version = extra_vars["version"]
        self.environment = extra_vars["environment"]
        self.start_timestamp = get_timestamp()
Here, i get 3 extra_vars variables (projet, the project i deploy, version, the deployed version, environment, the target environment : dev, prod…) and set them to the self object. I also initialize a start_timestamp variable, which contains the time when the playbook begins.
In short, it is easy to define more variables in the self object. These variables can be used later in others functions.
playbook on stats
The playbook_on_stats function is called at the end of a deployment, and makes it possible to get the deployment summary (unreachable, skipped, changed tasks…), by host. Example :
def playbook_on_stats(self, stats):
    hosts = stats.processed.keys()
    for h in hosts:
        summary = stats.summarize(h)
You can for example get a summary by host, or generates a global summary.
Log generation
Now, you just need to write the callback object functions for generating logs to the desired format. Here is a simple example which sends (using the requests package) a log to a webserver when a task fails:
def runner_on_failed(self, host, res, ignore_errors=False):
    task = self.task
    result = {
        "timestamp": get_timestamp(),
        "host": host,
        "type": "task_failed",
        "task": task.name,
        "role": task.role_name,
        "result": json.dumps(res),
        "version": self.version,  = variables from extra_vars (see before)
        "environment": self.environment,
        "project": self.project,
        "start_timestamp": self.start_timestamp
    }
    requests.post(url_web_server, data=json.dumps(result))
This log will contain the timestamp of the task, the host, the task type task_failed), the task name, the role, and the self variables defined earlier in playbook_on_start.
You can write a similar code in all other functions, and your web server will receive very interesting logs.
Collect and store your logs
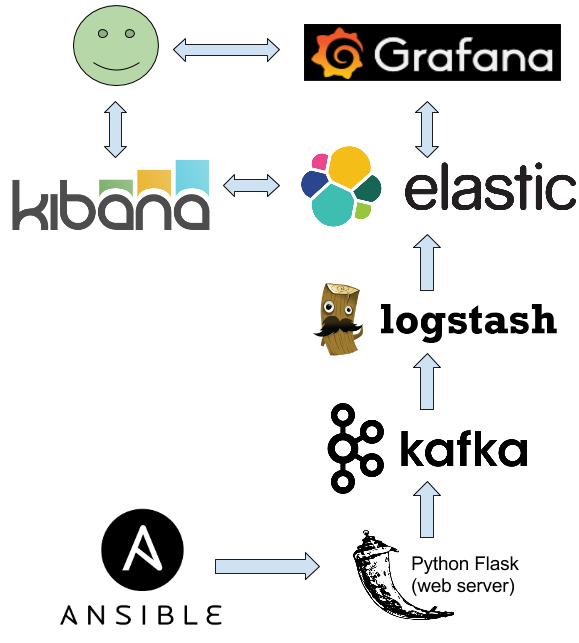
Possibilities in callback plugins are endless. I chose to send my logs to a Python web server using Flask. Then, the web server sends the log to Kafka. Logstash collects the logs from Kafka, and push them into Elasticsearch.

With Elasticsearch, you can make complex queries and graphs on your logs using Kibana and Grafana.
Exploit logs
With informations provided by a simple callback plugin, i can:
-
Make complex queries in Kibana (example: get all the failed tasks for my HAproxy role for a particular projet on the pre-production environment). Furthermore, all logs are centralized in the same place, and not scattered into multiples Jenkins instances/jobs.
-
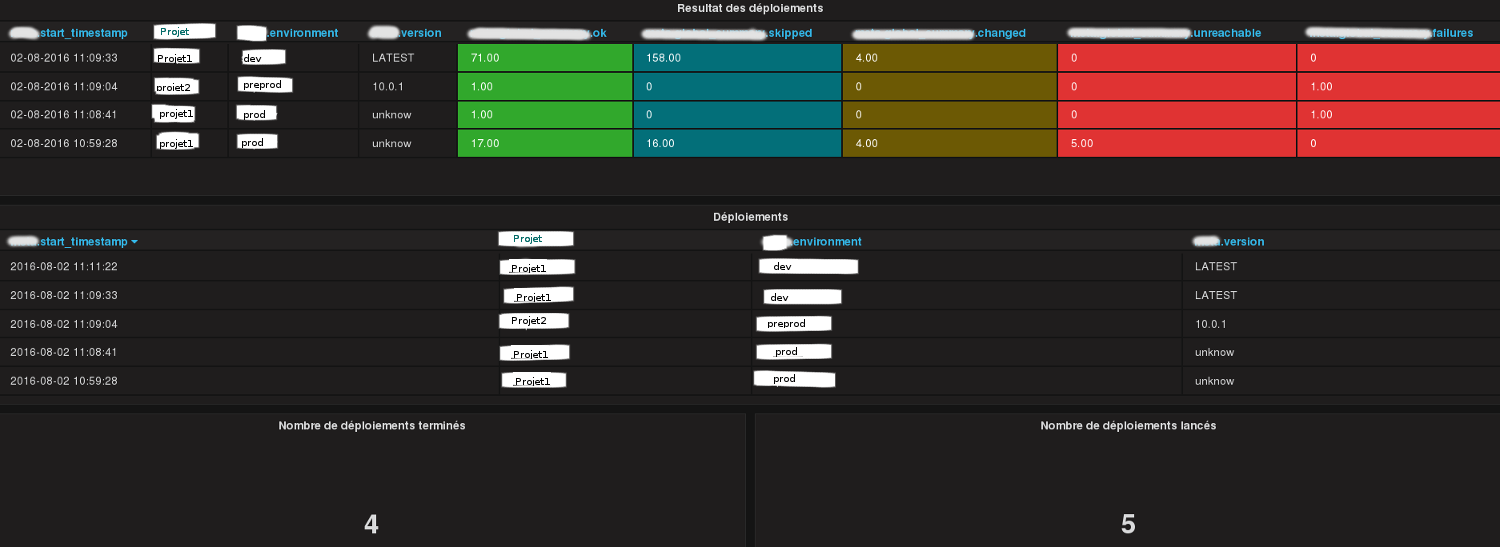
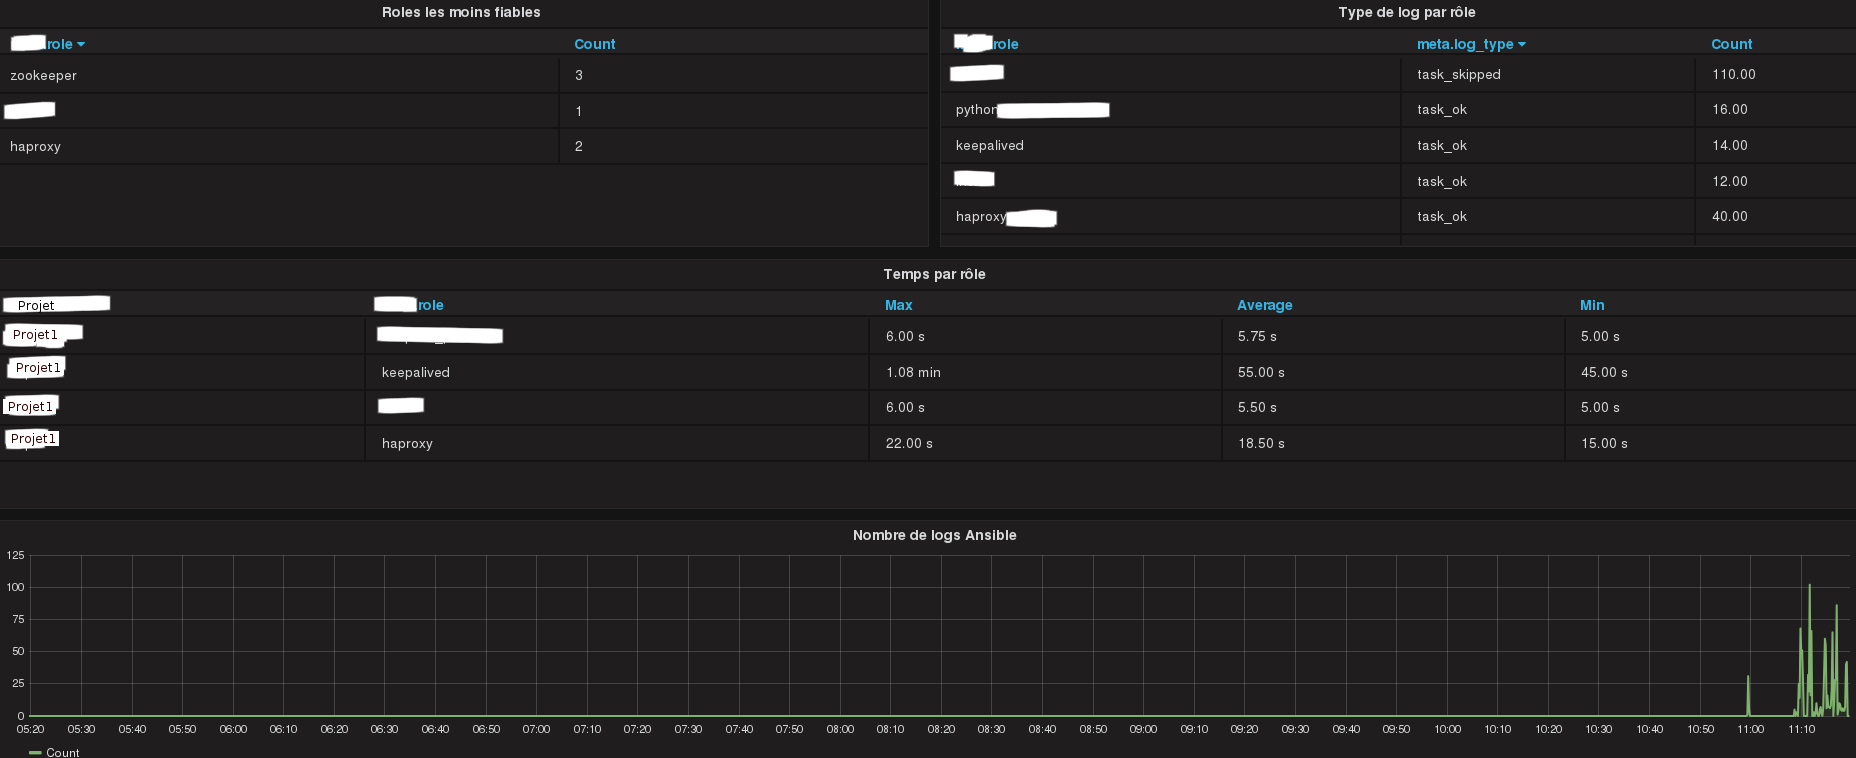
In Grafana, by project:
-
Summaries of the last deployments (start time, environment, success or not, number of tasks skipped/changed/unreachable…).
-
List of all started deployments (including the current ones).
-
List of all completed deployments.
-
Numvber of task for each role with their types (changed, skipped, success…).
-
Number of time a role has failed.
-
Least reliable roles list.
-
Execution time of each role (max, min, average…).


Considers transforming some logs, for example the res parameter. These parameters can be very long (thousands of characters), particularly on certain tasks like unarchive. You can for example truncate too long messages.
Ansible 2
The porting guide shows how to use the callback plugins in Ansible 2. Unfortunaly, parts of the code must change :
-
extra_vars are not accessibles in playbook_on_start but only from v2_playbook_on_play_start, in a different way:
extra_vars = play.get_variable_manager().extra_varsThe role name is accessible in v2_playbook_on_task_start. You can do for example:
if task._role is not None:  = on verifie si c'est un role ou non
    task.role_name = task._role._role_name
Conclusion
You can do a lot of things with Ansible callback plugins. I think it is possible to build with them a real Ansible control center (with statistics, alerting…).